
loading
loading


Embraer conducts its planning with a 15-year horizon, but attentive to external scenarios, the company promotes annual review cycles with all administrative and operational departments. The strategic plan is approved by the Board of Directors, which evaluates it based on risk management, growth expectations and stakeholder demands.
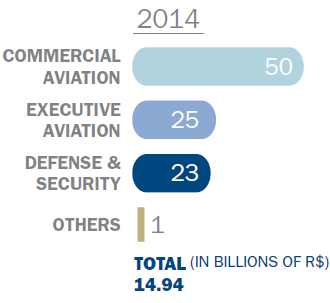
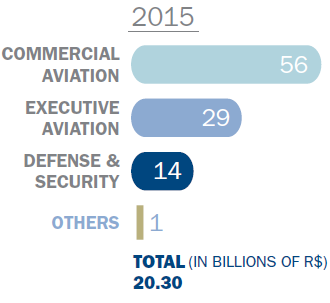
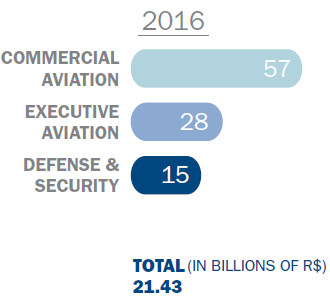
The review process carried out in 2016 considered the economic moment faced in the aerospace and defense segments, which resulted in a decrease in the number of sales in the segment, especially in Executive Aviation, in relation to the last eight years. In this scenario, Embraer adjusted costs, expenses and operations – essential adjustments to uphold the commitment to the goals set forth.
During the year, the company announced the closure of Harpia Sistemas S.A and Harbin Embraer Aircraft Industry Co. joint venture (HEAI) and, consequently, the termination of the manufacturing of the Legacy 650 jets in China. G4-13
Commercial Aviation | Solidify Embraer’s leadership position in its segment, expanding the customer base, perfecting the E-Jets, and pursuing excellence in the customer support model.
Executive Aviation | Consolidate Embraer’s position as one of the world’s most admired brands of executive jets, with recognition of customers for the quality of products and service.
Defense & Security | Maintain Embraer’s leading position in the domestic market and expand its international performance through the modernization of products and support services.
Business Diversification | Develop new business from the core competencies of the company, accelerating the adoption of new technologies and business models.
People, sustainability, organization and processes | Keep advancing as a global organization committed both to delivering customer satisfaction and valuing its people; a company that grows sustainably and serves as reference in the market for innovation and corporate excellence.
Annually, during the review cycle of the strategic plan, Embraer identifies and prioritizes its intangible assets in order to guide its performance as a company that values people and is committed to customers and business excellence.
Brand | Monitored by material published in the press, presence in the sustainability indices and external acknowledgments referring to the management of people and the quality of service and products (see Awards and recognition).
Knowledge | Measured through the maturity index of processes implemented in the company, as well as by the practices of knowledge management.
Intellectual property | Measured by number of patents for inventions and for industrial designs.
People | Evaluated periodically by competencies (see Development and training). Another indicator is external recognition related to personnel management (see Awards and recognition).
Leadership | 360° evaluations (see Development and training).
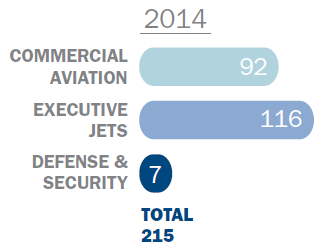
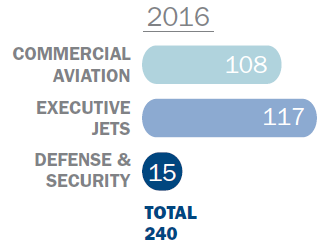
The year was challenging for Embraer due to reduced sales in the Defense & Security and Executive Aviation, in line with other companies in these segments. The consolidated results, however, were positive in light of the good performance of the Commercial Aviation segment and the reduction of costs and expenses, mainly for the qualification of sales and margin improvement in Executive Aviation.
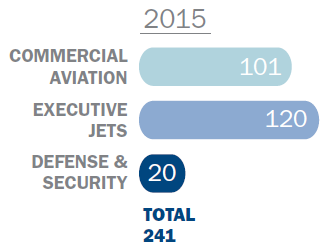
In 2016, the company delivered 240 aircraft, the same volume as the previous year. Net revenue was US$6,217.5 million, slightly higher than the estimates for the year.
Operating income (EBIT) and operating margin closed 2016 at R$717.8 million and 3.3%, respectively, slightly down when compared to the previous year (operating income of R$1,103.1 million and operating margin of 5.4%) due to non-recurring items, such as provisions related to the termination of the investigation of non-compliance with U.S. authorities, and also related to the payment of benefits offered in the Voluntary Dismissal Program (PDV, in Portuguese). Excluding these factors, adjusted EBIT was R$1,700.5 million and adjusted EBIT margin was 7.9%, in line with the company’s annual guidance.
Adjusted net income, excluding deferred income and social contribution taxes related to the impact of exchange variation on non-monetary assets, and also the aforementioned provisions, was R$964.9 million. Adjusted earnings per share were R$1,3179 for the year.
In 2016, the company had a negative adjusted free cash flow of R$1,478.7 million, lower than the positive free cash flow of R$1,391.7 million in 2015, mainly due to lower cash generation from operating activities, and also due to an increase in investments in property, plant and equipment as well as the development of new products.
| Millions of R$* | 2016 | Variation 2016/2015 | 2015 | 2014 |
|---|---|---|---|---|
| Net income | 21,435.7 | 6% | 20,301.8 | 14,935.9 |
| Gross margin | 19.9% | 1.4 p.p. | 18.5% | 19.8% |
| Adjusted operating profit1 (EBIT) | 1,700.5 | 14% | 1,493.7 | 1,303.8 |
| Adjusted operating margin | 7.9% | 0.5 p.p. | 7.4% | 8.7% |
| Adjusted EBITDA2 | 2,844.2 | 16% | 2,450.6 | 1,980.7 |
| Adjusted EBITDA margin | 13.3% | 1.2 p.p. | 12.1% | 13.3% |
| Net profit | 585.4 | 142% | 241.6 | 796.1 |
| Net margin | 2.7% | 1.5 p.p. | 1.2% | 5.3% |
| Investments3 | 12,458.8 | (7%) | 13,409.1 | 8,731.2 |
| Debt | 12,254.0 | (11%) | 13,785.7 | 6,662.0 |
| Net cash (debt) | (1,873.0) | (6,695%) | 28.4 | (102.6) |
| Total assets | 38,016.7 | 17% | 45,566.9 | 27,653.6 |
| Net equity | 12,844.9 | (14%) | 15,008.7 | 10,265.4 |
| Net debt/equity* | 1.0 | 11% | 0.9 | 0.6 |
| ROA | 1.6% | 1.1 p.p. | 0.5% | 2.9% |
| ROE | 4.6% | 3.0 p.p. | 1.6% | 7.8% |
| ROCE4 | 0.2% | (6.1 p.p.) | 6.3% | 11.6% |
| Inventory | 8,136.2 | (10%) | 9,037.9 | 6,388.9 |
| Inventory turnover* | 2.1 | 17% | 1.8 | 1.9 |
| Asset turnover* | 0.6 | 50% | 0.4 | 0.5 |
| Backlog of firm orders (billions in USD) | 19.6 | (13%) | 22.5 | 20.9 |
| Delivery of aircraft (units) | 240 | 241 | 215 | |
| Number of employees | 18,506 | (4%) | 19,373 | 19,167 |
| EBIT per employee (in thousands of R$) | 91.9 | 19% | 77.1 | 68.0 |
| Distributed dividends | 148.6 | 26% | 117.8 | 214.4 |
| Profit per share1(R$) | 0.7959 | 141% | 0.3309 | 1.0851 |
| Quantity of shares (thousand)1,5 | 735,571 | 1% | 730,205 | 733,677 |
Verified numbers are in compliance with the IFRS international accounting norm.
* Except Debt/Net Equity, Inventory Turnover, Asset Turnover, Profit per Share and Quantity of Shares.
1. The ajusted term is used for amounts calculated excluding provisions relating to non-recurring items that impacted the result of the period. 2. Represents net profit plus net financial revenue (expenses), income tax and social contributions, depreciation and amortization, minority shareholding and equity pickup. 3. Values include investments in Development, CAPEX and Shareholding. 4. ROCE = NOPAT/Shares employed with non-monetary items period average. 5. Weighted average of existing basic shares during the fiscal year, excluding shares acquired by the company and kept in the treasury.
The shares traded on the BM&FBOVESPA (EMBR3) closed 2016 quoted at R$16.00. The American Depositary Receipts (ADRs) traded in New York (NYSE: ERJ) ended the year quoted at US$19.25. Embraer’s market value was US$3.6 billion at the end of the year (US$5.5 billion in 2015).
In 2016, the credit risk classification agencies Fitch Ratings and Standard & Poor’s (S&P) Ratings Services reiterated the BBB classification for Embraer. The same rating applies to securities issued abroad.
Fitch also attributed a national long-term grade of AAA (BRA) and S&P removed the negative company classification in CreditWatch, a sign that credit ratings will be reevaluated.
Added value for the year was R$5,733.2 million, which indicates a small decrease of 2.94% in relation to what was recorded for the previous year. For shareholders, Embraer distributed R$73.6 million in interest on capital and R$75.0 million in dividends, totaling R$148.6 million, with a payout of 25.4% of net consolidated profit, R$585.4 million. Profit per share was R$0.7959. Emphasis should be given to the distribution of R$3,557.1 million in value to employees and R$592.8 million to federal and municipal governments in the form of taxes and contributions. See more information in the financial statements. G4-EC1

| 2016 | 2015 | 2014 | |
|---|---|---|---|
| Revenue | 23,416.0 | 22,360.1 | 16,343.0 |
| Inputs acquired from third-parties | (17,157.1) | (16,364.1) | (11,144.2) |
| Gross added value | 6,258.9 | 5,996.0 | 5,198.8 |
| Depreciation and amortization | (1,265.6) | (1,073.4) | (676.8) |
| Net added value produced by the entity | 4,993.3 | 4,922.6 | 4,522.0 |
| Received added value being transferred | 739.9 | 605.2 | 418.7 |
| Distribution of added value | 5,733.2 | 5,527.8 | 4,940.7 |
| Personnel | 3,557.1 | 3,342.4 | 2,502.3 |
| Government (taxes, rates and contributions) | 592.8 | 1,251.6 | 1,058.1 |
| Interest and rentals | 991.7 | 652.2 | 553.7 |
| JCP and dividends | 174.0 | 117.8 | 214.3 |
| Retained profit/losses from fiscal year | 411.4 | 123.8 | 581.8 |
| Shares of non-controllers | 6.4 | 40.0 | 30.5 |
For more information, access the Annual Financial Statement.